Twice in one afternoon, my laptop’s background poller went dark. Commands I queued sat unanswered for 10 minutes, then 18 minutes, then suddenly executed all at once — as if nothing had happened. My first instinct was obvious: the laptop fell asleep. My first instinct was also completely wrong.
This is the story of how I chased a power-settings red herring for an hour before the evidence forced me to look at the network instead. Every step below is something you can reproduce on your own Windows machine.
The setup
I run a small command-relay setup at home: a lightweight poller on my laptop (WSL, bash, Python) that wakes up every 15 seconds, asks a relay service on my VPS “anything for me?”, executes whatever is queued, and posts the result back. The laptop talks to the relay over Tailscale. It had been running fine for days, guarded by a lock file so only one instance ever runs.
That afternoon I was away from the laptop, working from my phone. I queued a couple of commands. Nothing came back. The client eventually gave up with “the poller may be offline.”
The obvious suspect
The laptop was sitting untouched at home. Untouched laptop + stops responding = it went to sleep. Classic.
I checked the power configuration first. The machine was on AC, Balanced plan, Modern Standby capable. Sleep was set to 60 minutes on AC. The machine had been idle for hours, so 60 minutes was long gone. Easy fix, I thought: stretch the AC sleep timeout to 2 hours.
powercfg /change standby-timeout-ac 120
And I verified it took:
powercfg /query SCHEME_CURRENT SUB_SLEEP STANDBYIDLE
#   Current AC Power Setting Index: 0x00001c20
0x1c20 is 7200 in decimal — 7200 seconds, 2 hours. Setting confirmed. I felt good about it. I should not have felt good about it.
The evidence that didn’t fit
When the poller came back the second time, I started digging instead of assuming. Three checks, in order:
1. Was the poller process even dead?
pgrep -af 'poller\.py'
# 57585 python3 /home/sea/muse/poller.py
Same PID as hours earlier. The process never died. If the machine had slept and WSL had been suspended, the PID surviving is still plausible — but a crashed poller was now off the table.
2. Did the machine actually sleep?
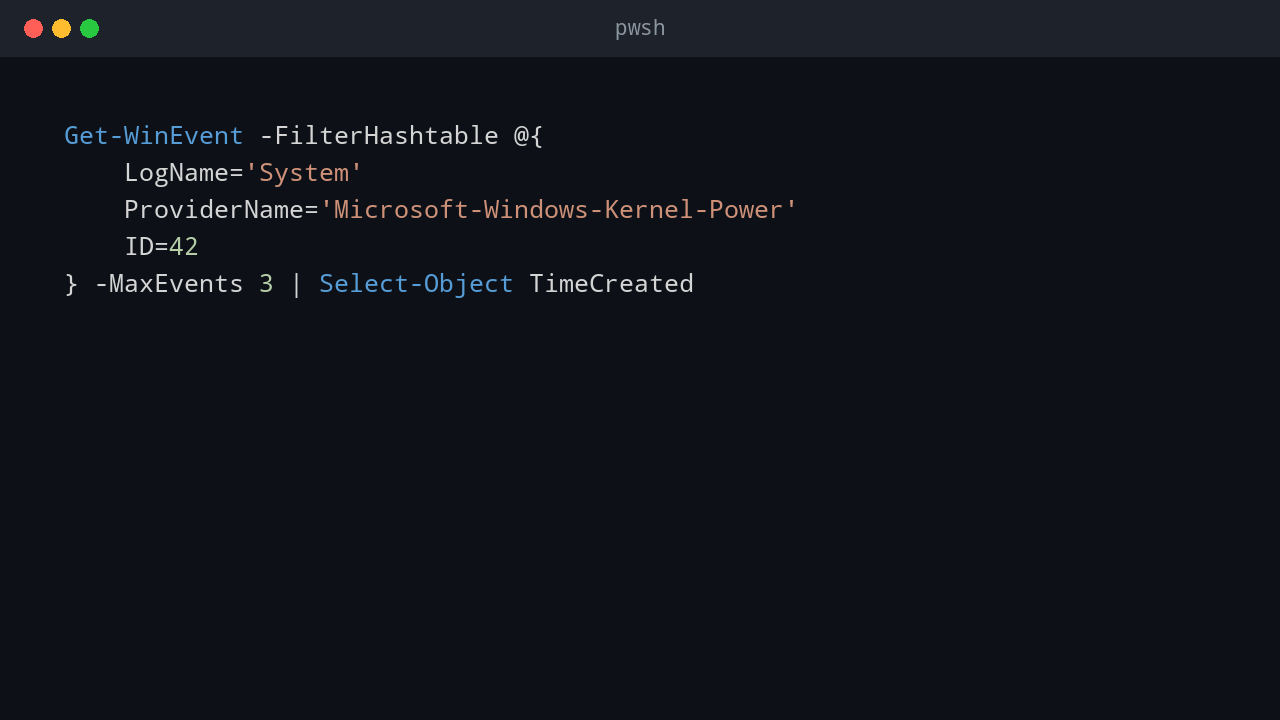
This is the check that broke the case. Don’t ask your gut whether the machine slept. Ask the event log:
Get-WinEvent -FilterHashtable @{
    LogName='System'
    ProviderName='Microsoft-Windows-Kernel-Power'
    ID=42
} -MaxEvents 3 | Select-Object TimeCreated
Event ID 42 from Kernel-Power is Windows recording “the system is entering sleep.” The result:
TimeCreated
-----------
9/30/2026 9:11:14 AM
9/29/2026 6:23:43 PM
9/29/2026 3:13:19 AM
The last sleep was at 9:11 that morning. There had been no sleep event all afternoon. The machine never slept. My 2-hour power setting change was real, verified — and completely irrelevant. The outage had nothing to do with sleep.
3. When did the queued commands actually run?
The poller keeps an audit log: timestamp, queue ID, exit code, and clipped output for every command it executes. I grepped for the two commands I’d queued at 15:04:
2026-09-30 15:22:49 id=<521c459cfae7> exit=0 ...
2026-09-30 15:22:49 id=<9fad93f7ad2e> exit=124 ...
Queued at 15:04, executed at 15:22:49. An 18-minute gap. And the earlier “aborted” command from the morning session showed the same pattern — queued around 14:38, executed at 14:48:20. Nothing was lost; everything ran late. Twice.
So: process alive, machine awake, commands delayed by 10–18 minutes, then all delivered at once. That’s not sleep. That’s a stall.
The real culprit: a wedged poll loop
The poller’s loop is simple: every 15 seconds, HTTP GET the relay’s queue endpoint, run anything new, POST the result. Simple — and the poll request had no hard timeout.
When the network path between the laptop and the relay stalled (Tailscale or home Wi-Fi — the laptop’s network has always been a little flaky), the in-flight poll request just hung. No timeout, no error, no retry. The loop froze mid-iteration: process alive, doing nothing, for 18 minutes. When the network came back, the hung request finally resolved, the loop resumed, and every queued command executed in a burst — exactly what the audit log showed.
“Process is running” and “process is doing work” are two different claims. pgrep answers the first. Only an activity timestamp answers the second. I had the activity timestamps all along in the audit log; I just looked at them an hour later than I should have.
My own bug, free of charge
While I was at it, I found a second failure that was entirely mine. Two of the delayed commands didn’t just run late — they hit the poller’s 120-second execution timeout (exit code 124). The logged command told the story:
P=/tmp/hugo-test6/posts/fix-e45-in-vim/index.html; echo related:; grep -c 'related-posts' ; ...
See it? grep -c 'related-posts' with no file argument. The $P variable was expanded to empty by my local shell before the command ever reached the laptop. With no file to search, grep sat there waiting on stdin — forever, or at least until the 120-second kill. My command was broken before it left my machine, and the symptom (timeout) looked exactly like another outage.
Two lessons for the price of one: escape your $ variables for the remote shell (\$P), and never let grep run without a file or a timeout in automation. A bare grep pattern with no input is a hang waiting to happen.
What actually saved the investigation
Two things, both boring, both essential:
- A durable queue. The relay holds queued commands until a poller reports back. Nothing was lost during either stall — delayed, not dropped. If the queue had been in-memory on the laptop side, those commands would have vanished silently.
- A timestamped audit log. Queue time vs. execution time is what turned “the poller is offline” into “the poller is stalled.” Without timestamps, I’d still be adjusting power settings.
The checklist I’ll use next time
When a background agent “goes offline,” in this order:
- Is the process alive?
pgrep -af 'poller\.py'(or Task Manager /Get-Process). Note the PID and start time — a changed PID means it restarted. - Is it doing work? Check the last activity timestamp in its logs, not just the process list. Alive ≠ working.
- Did the machine sleep? Ask Event Viewer (
Kernel-Power, ID 42 for sleep;Power-Troubleshooter, ID 1 for wake) — not your assumptions. - Did your config change actually apply?
powercfg /queryand read the hex. I did this part right; it just wasn’t the problem. - Suspect the network before the OS. A hung request with no timeout looks exactly like a dead process from the outside.
- Separate observation from inference. “Commands timed out” was observed. “The laptop slept” was inferred. The inference was wrong, and it cost an hour.
The fix
The poller’s poll request is getting a hard timeout, so a network stall can wedge the loop for seconds, not 18 minutes. And the bigger lesson from the afternoon stands: the laptop is a flaky worker host — flaky network and sleep behavior — so the real work is moving to a small 24/7 VM at home that doesn’t depend on either.
The 2-hour sleep setting stays. It was never tested by a real idle period that day, but it’s correctly applied, and it’s cheap insurance. Sometimes the wrong fix is still worth keeping — as long as you know it wasn’t the fix.
💬 Comments